
Overtime Podcast - Episode 2


Last updated: 2026-09-20
Page change log:
- Created: 2026-09-20
Page contents:
Watch the video!
This blog focuses on content shown during Clash Royale Overtime - Episode 2: Card Design and Balance!. If you want to understand the context in which these assets were shared and additional details, we strongly recommend you watch the full video, it has very interesting insights.
During the long conversation about card and game balance, Donald (Clash Royale Game Designer) shared some charts and infographics to complement the discussion. These assets are scattered across the 2+ hours of footage, so the goal of this blog is to group them together by category and make them easier to find.
We identified the following categories of assets:
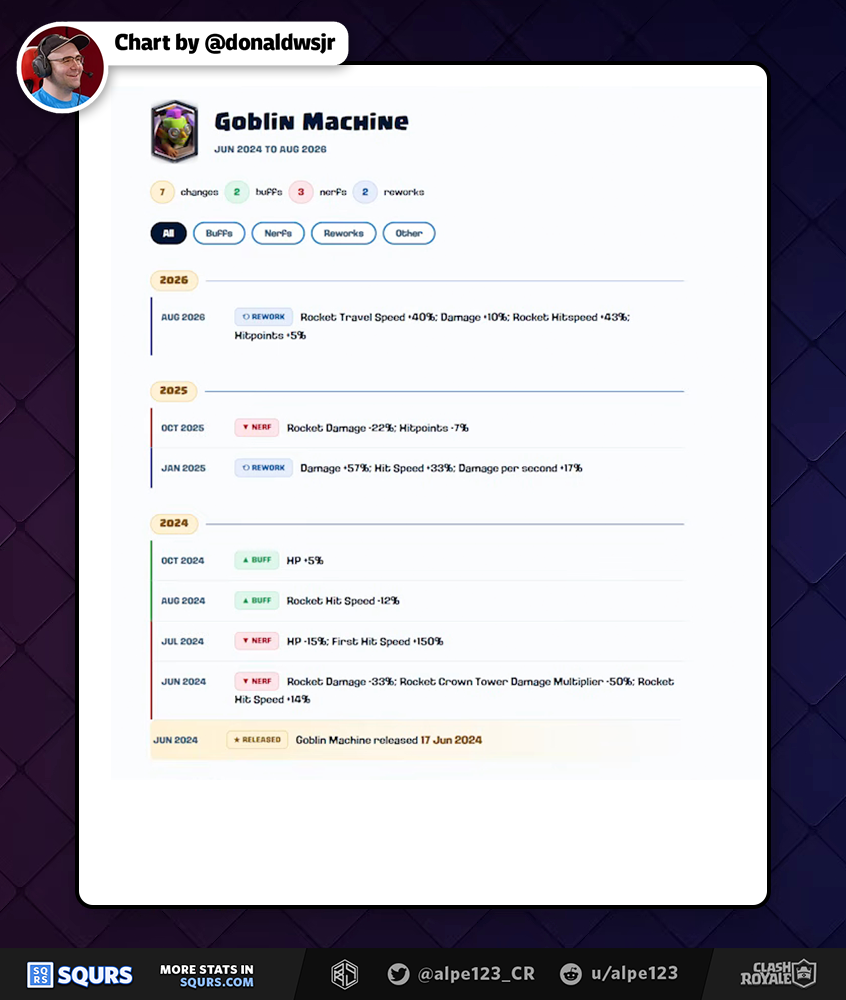
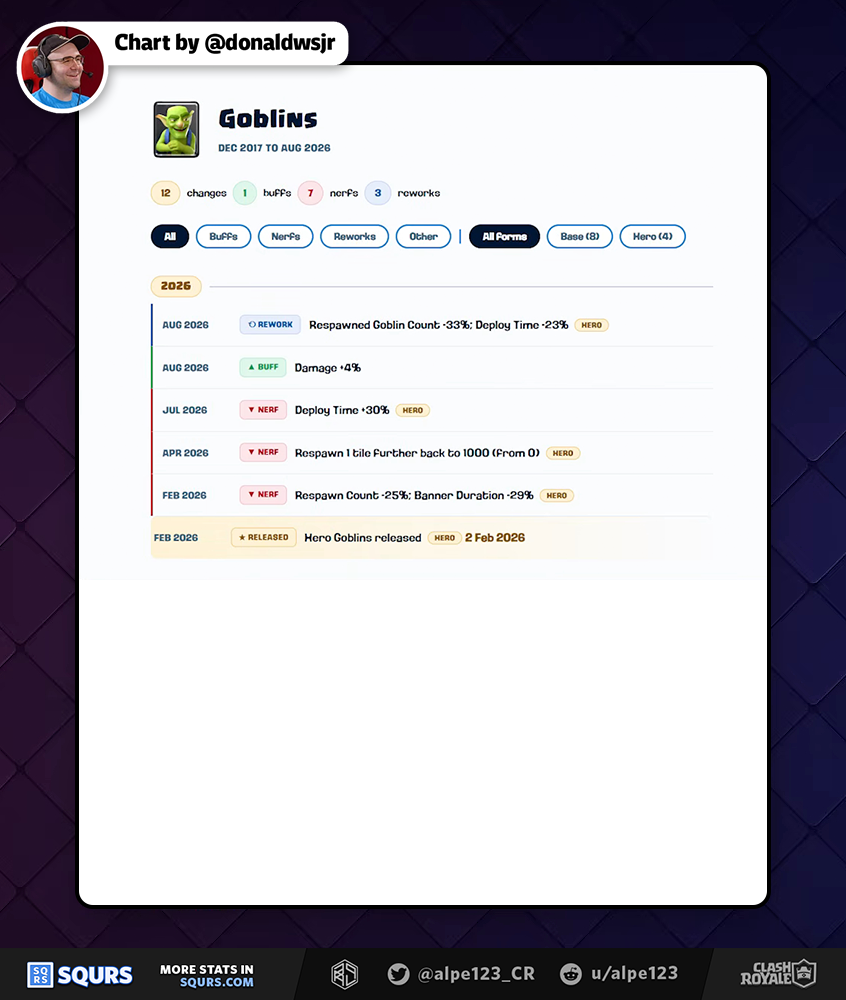
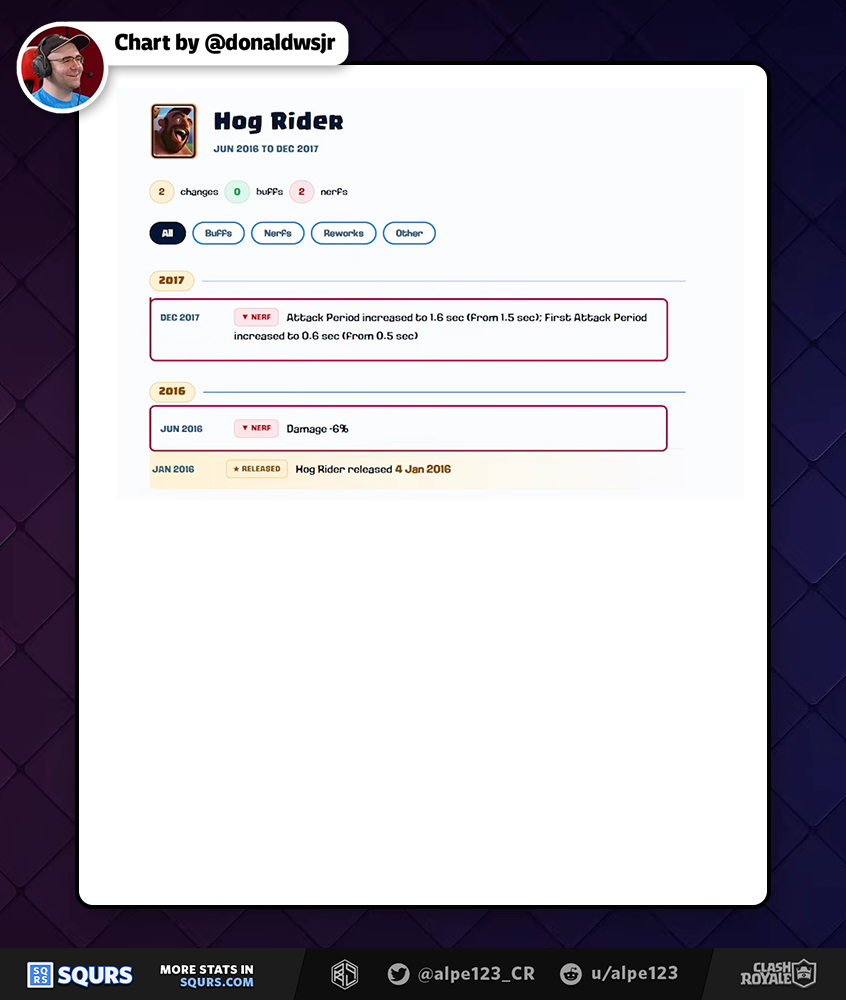
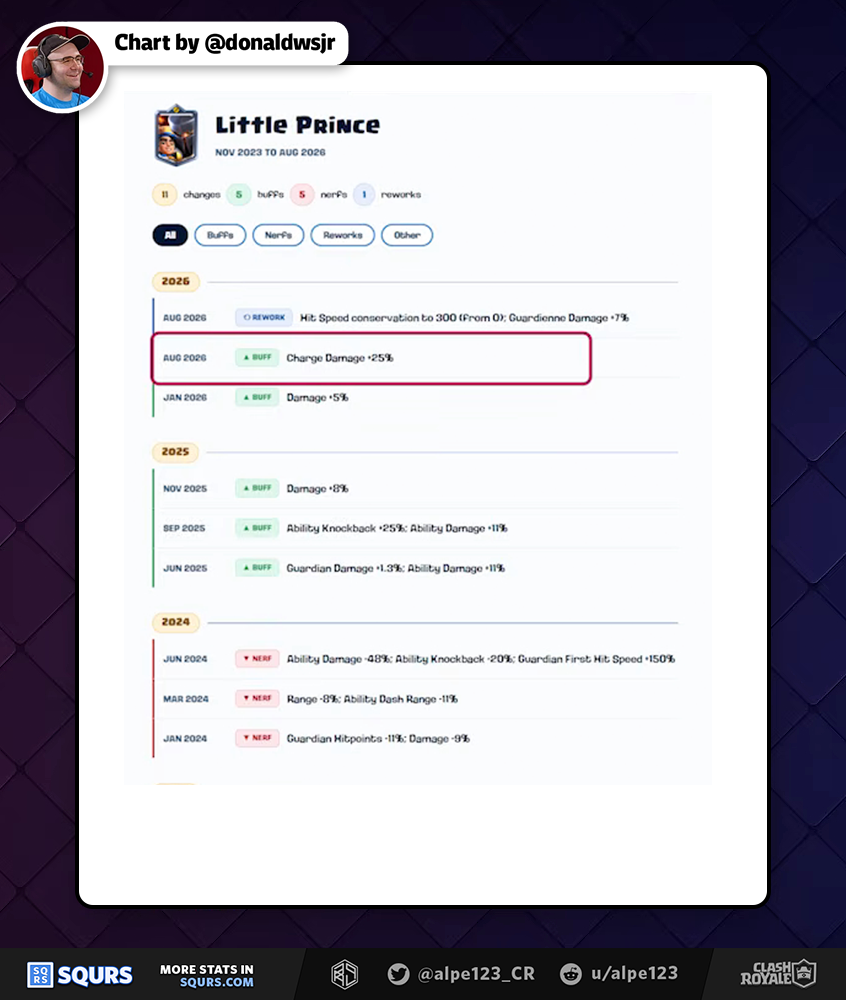
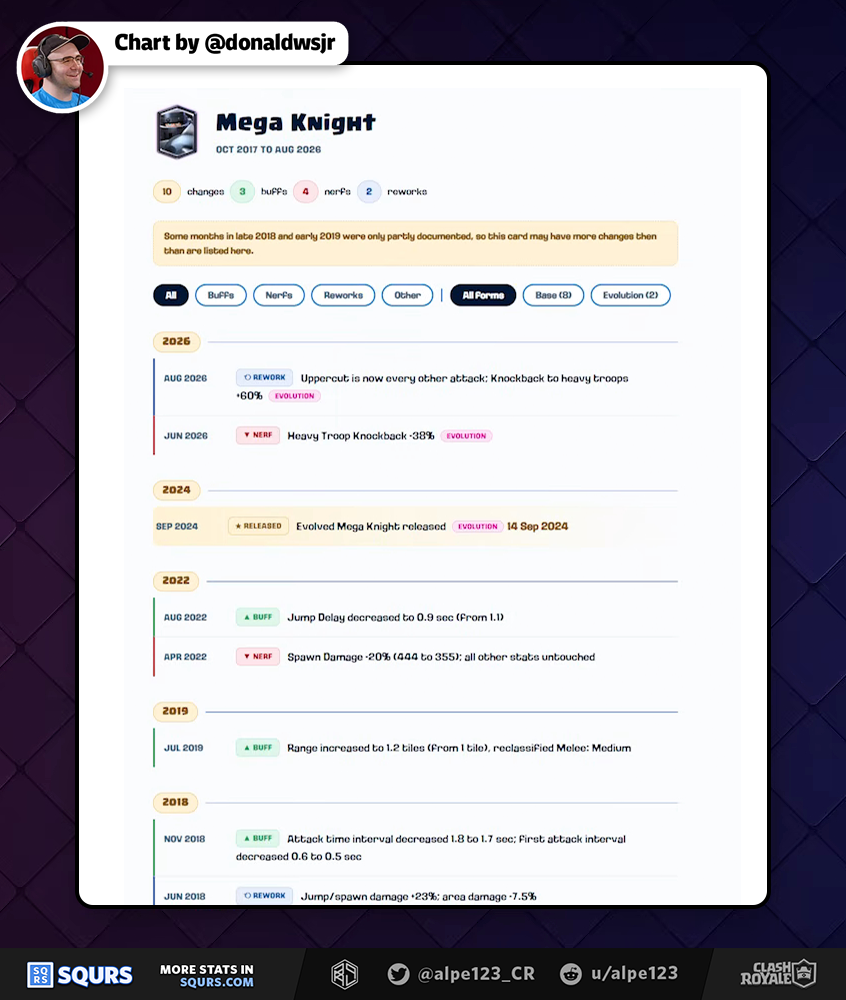
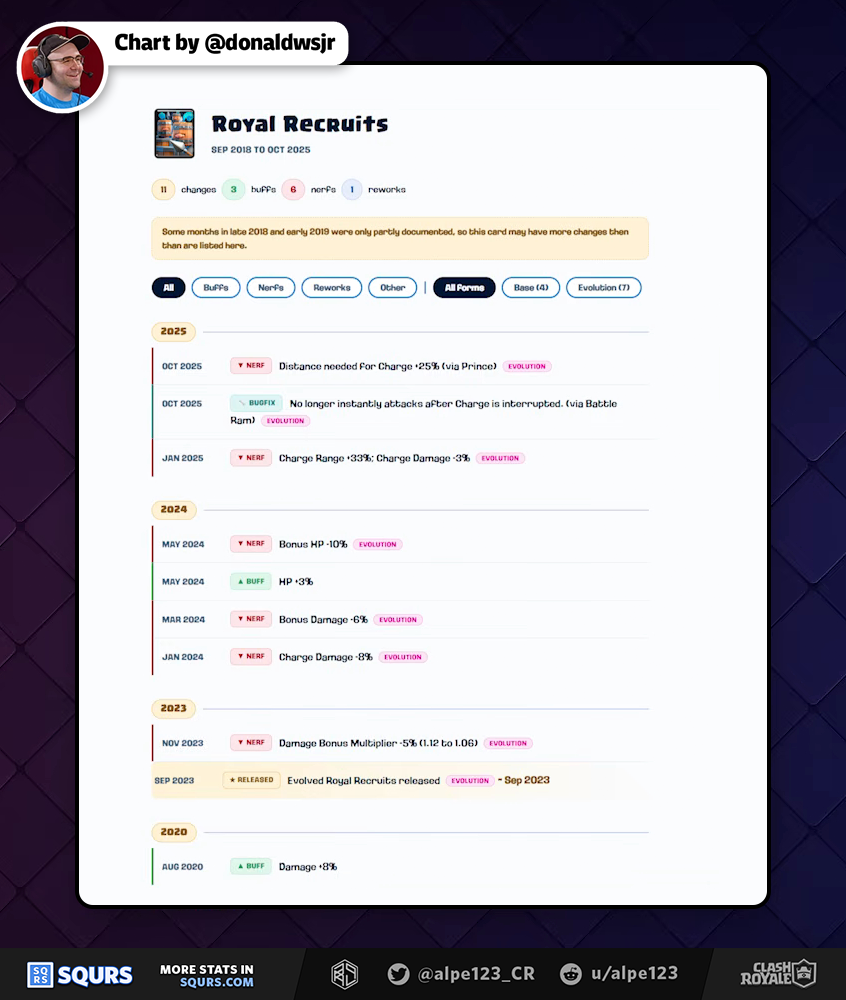
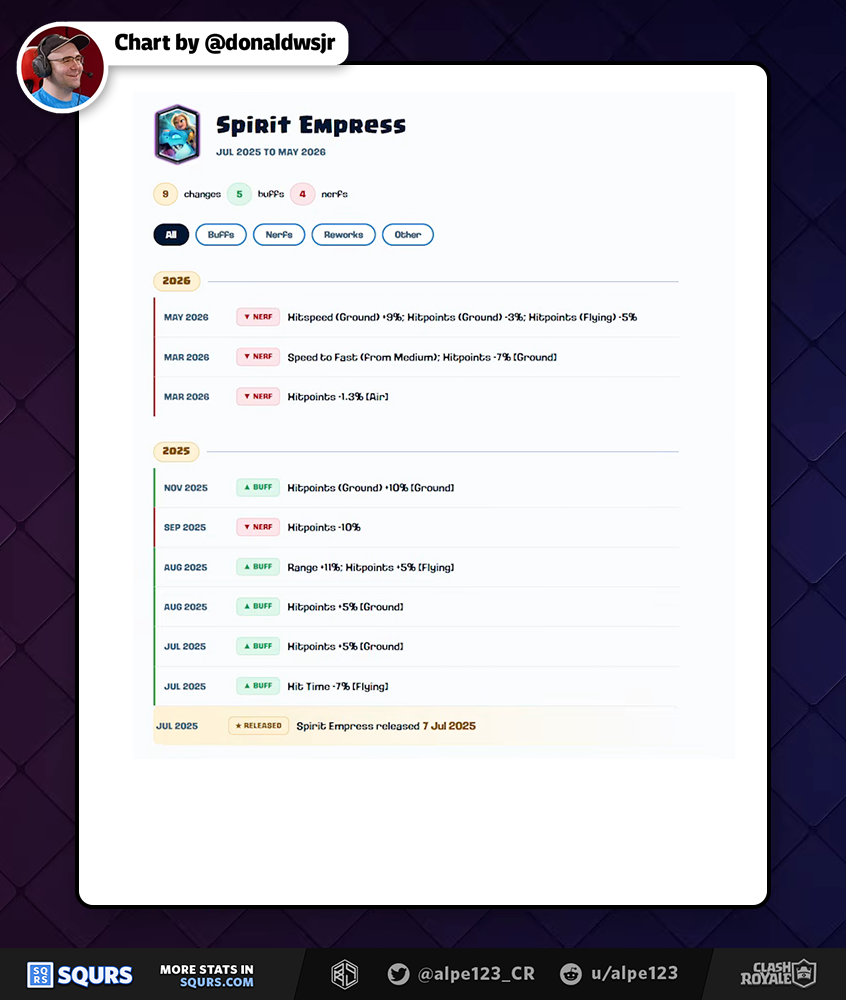
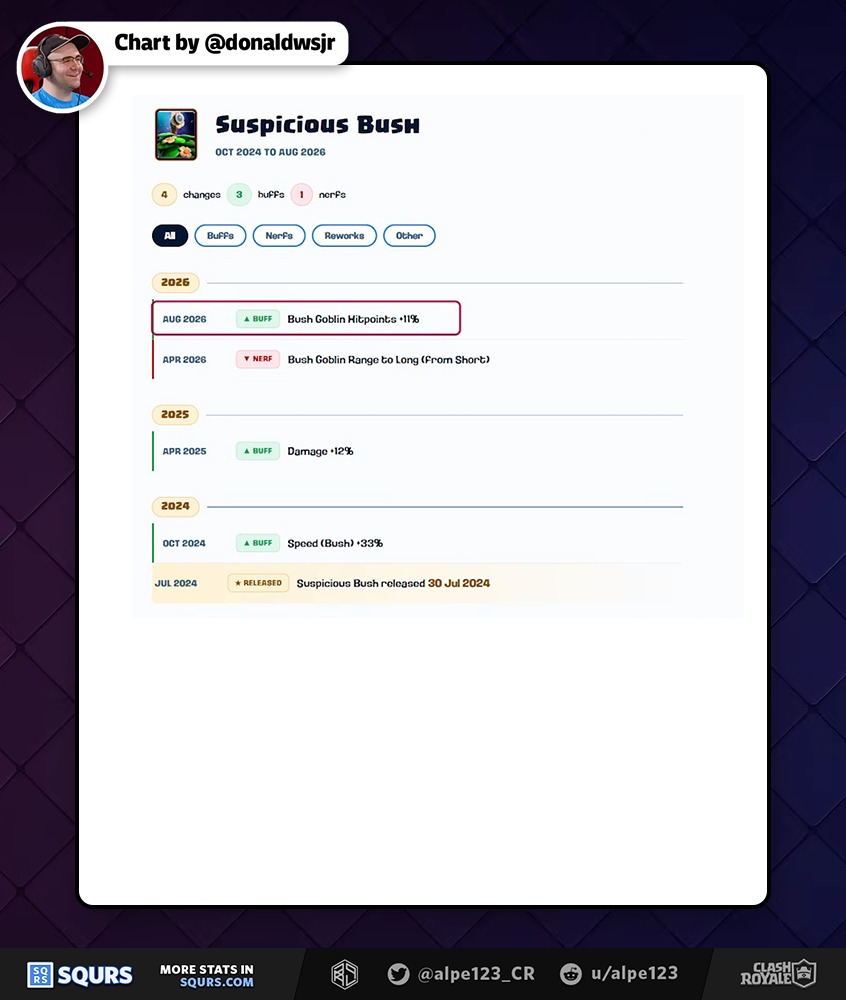
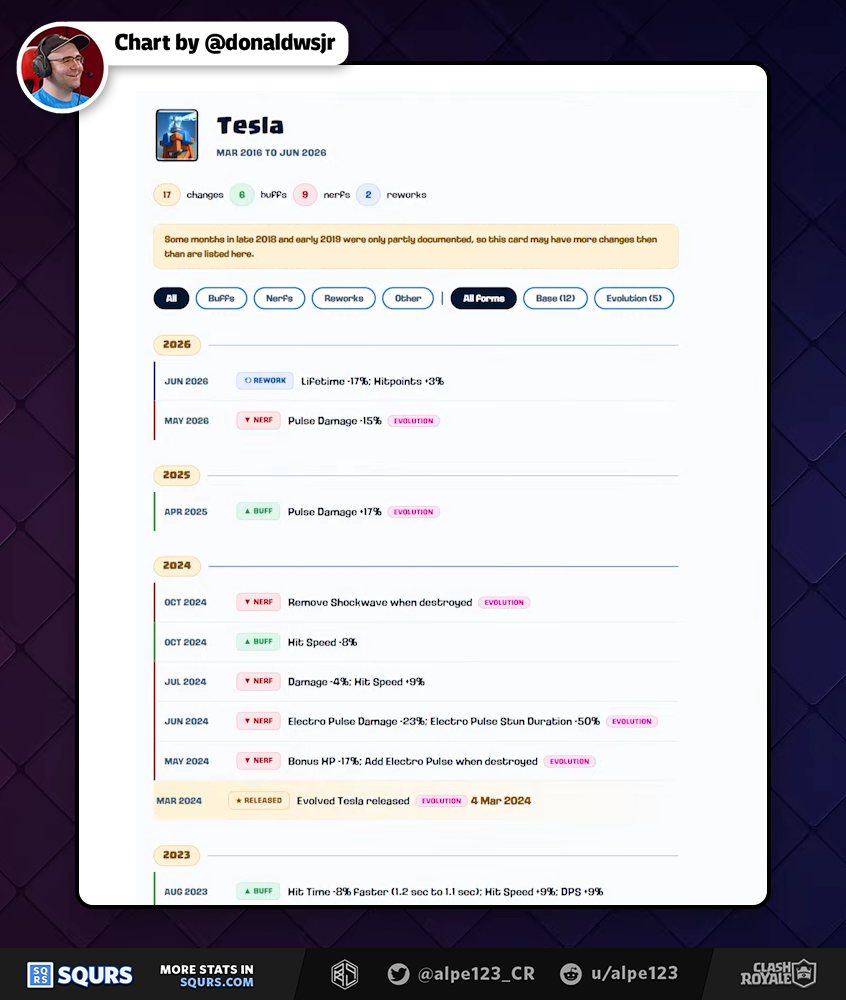
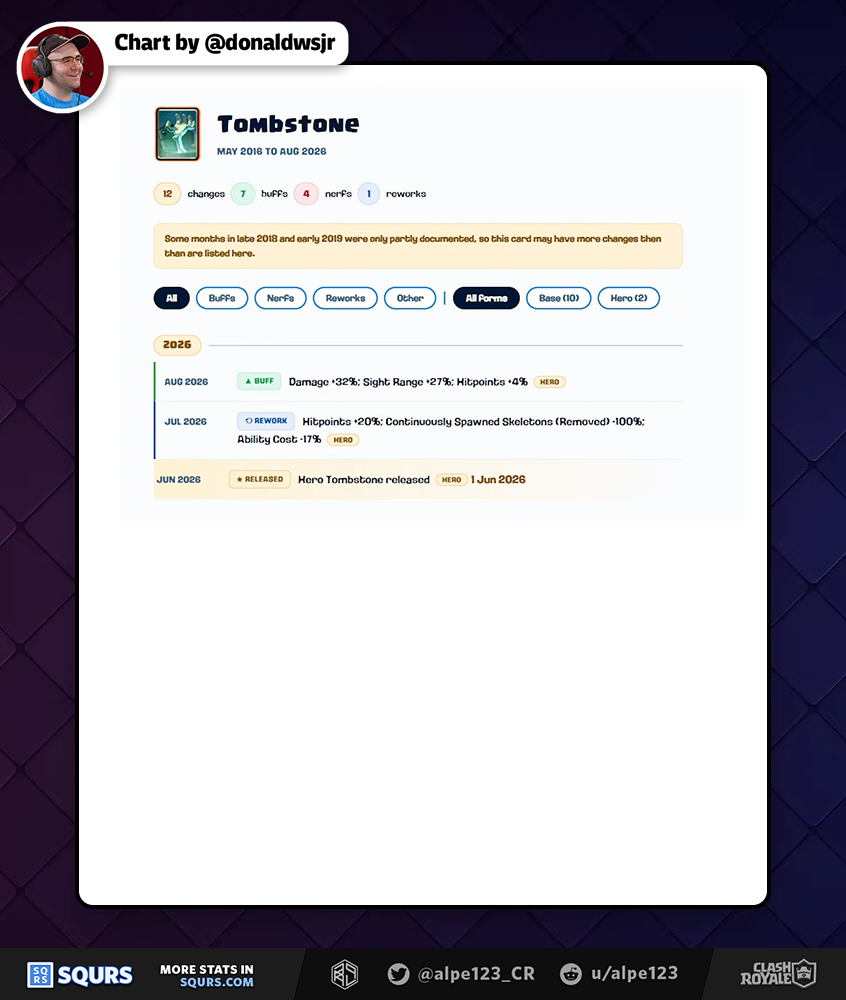
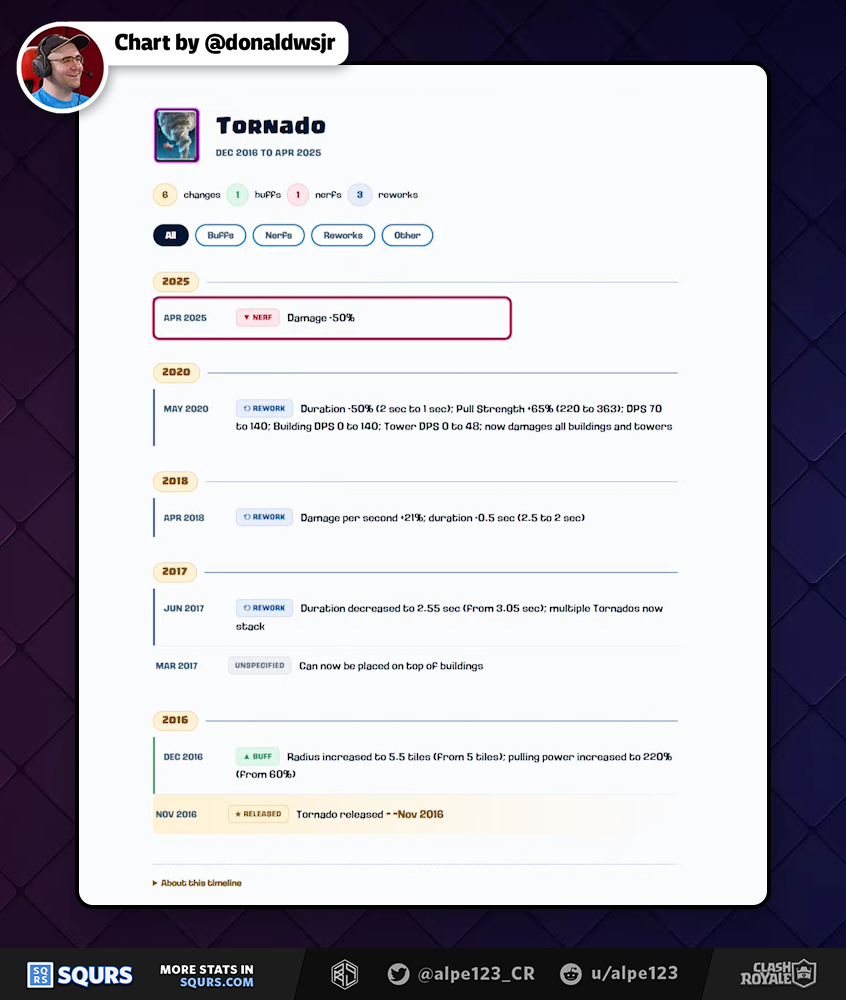
- Balance history: aggregated timeline of balance changes per card
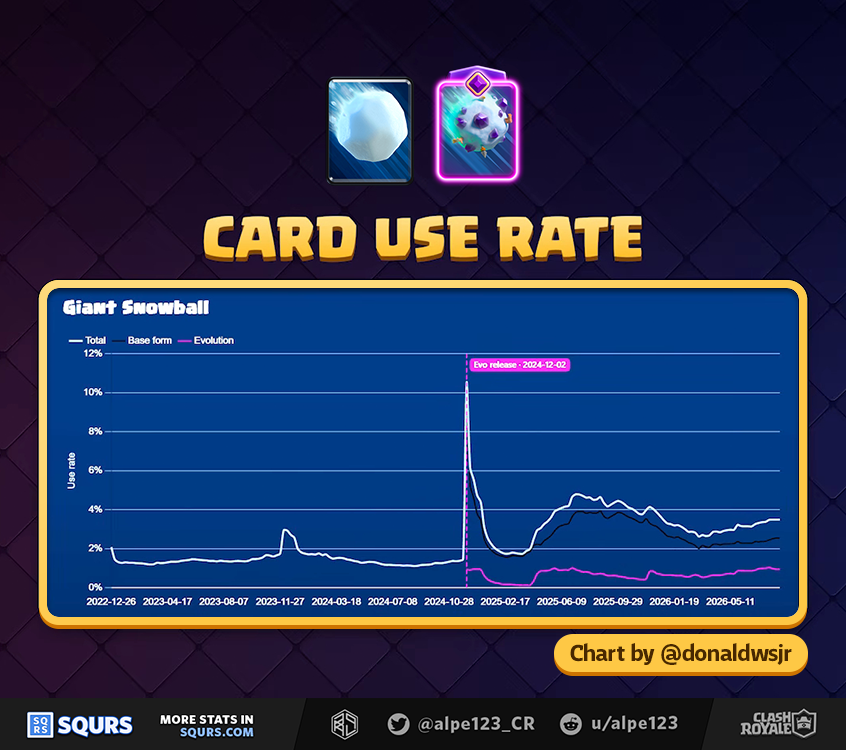
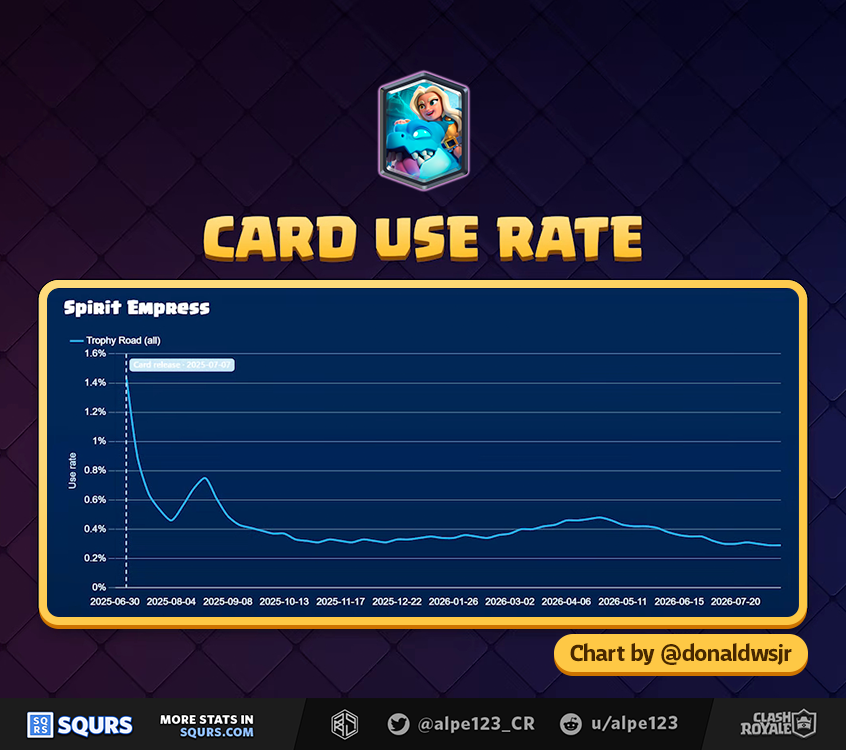
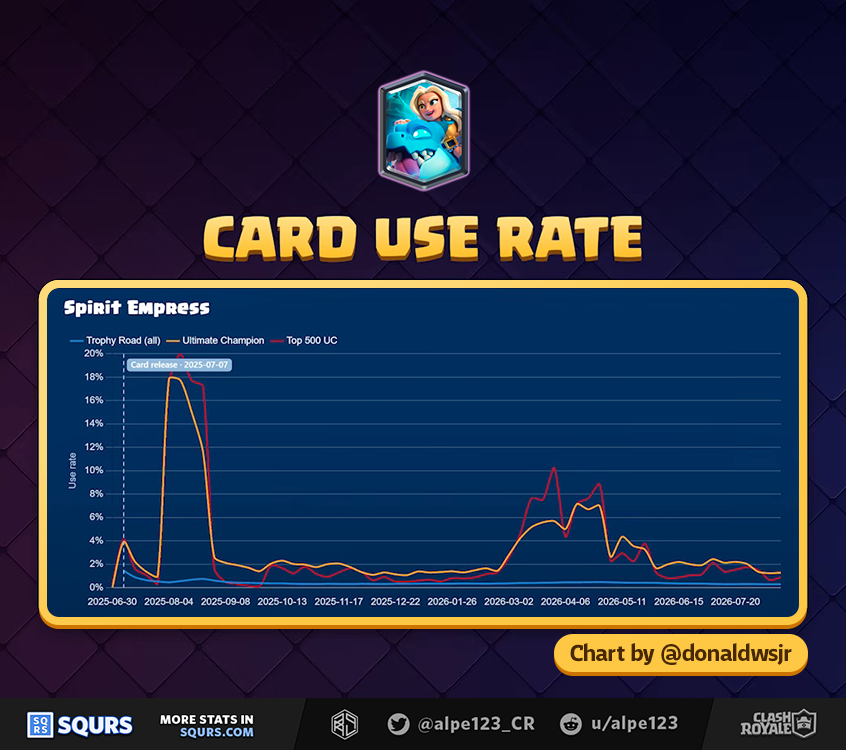
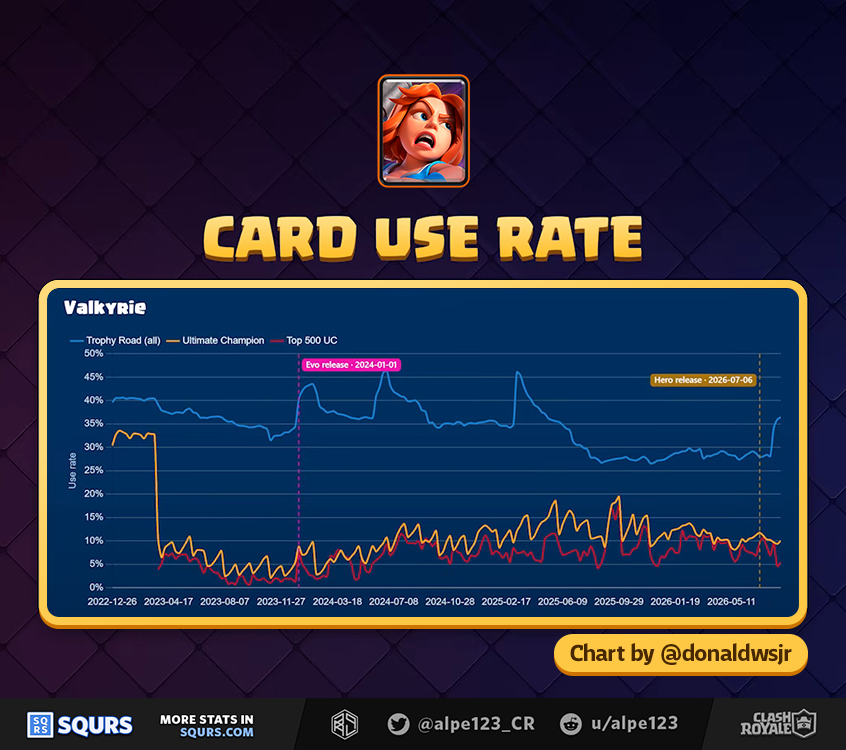
- Card usage: charts looking at how use rate changes over time
- By form: compares different card forms
- By mode: compares different game modes
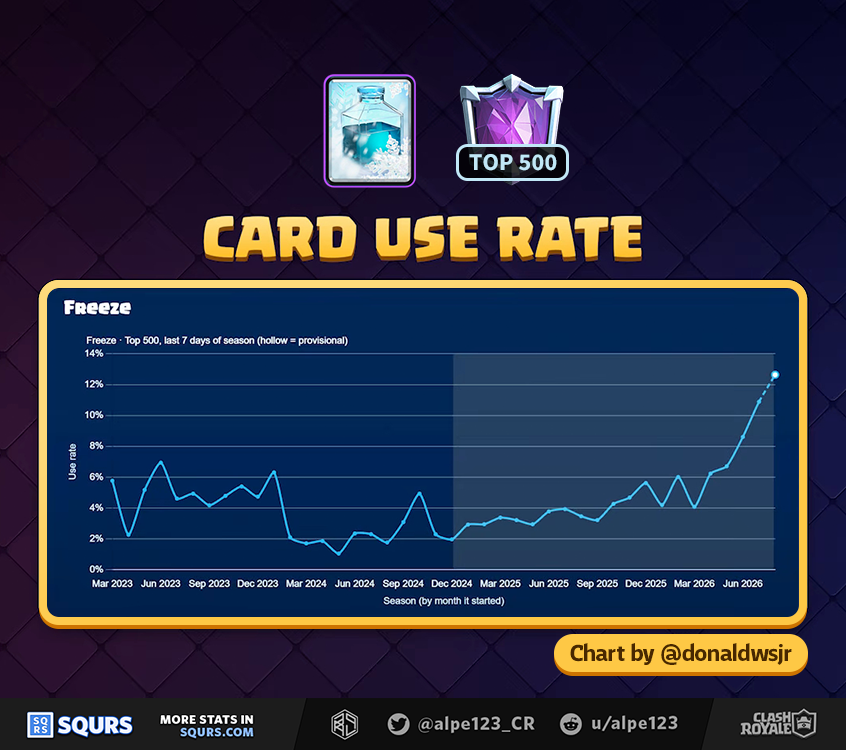
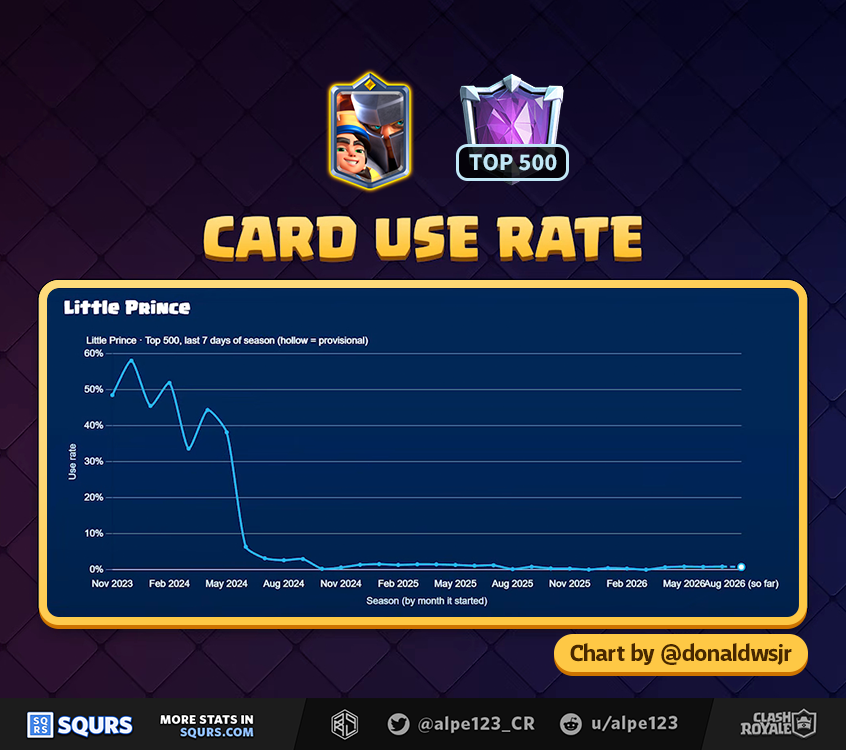
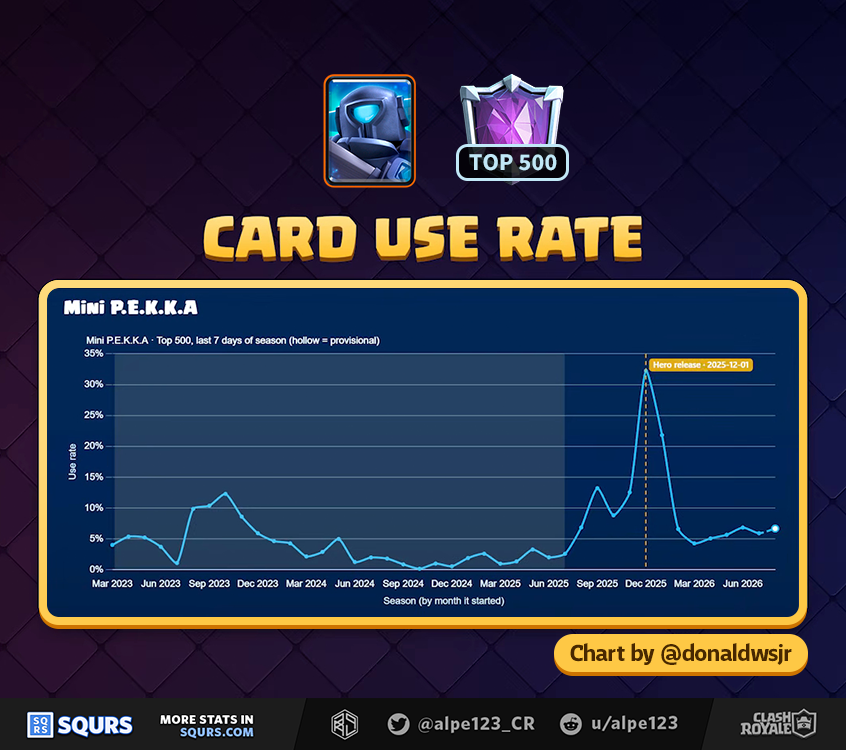
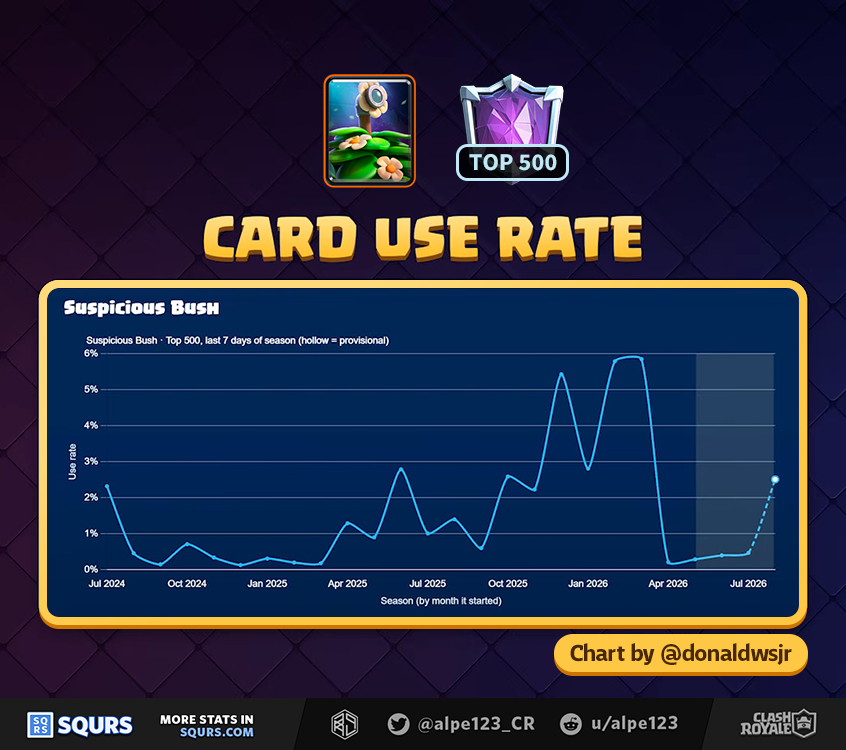
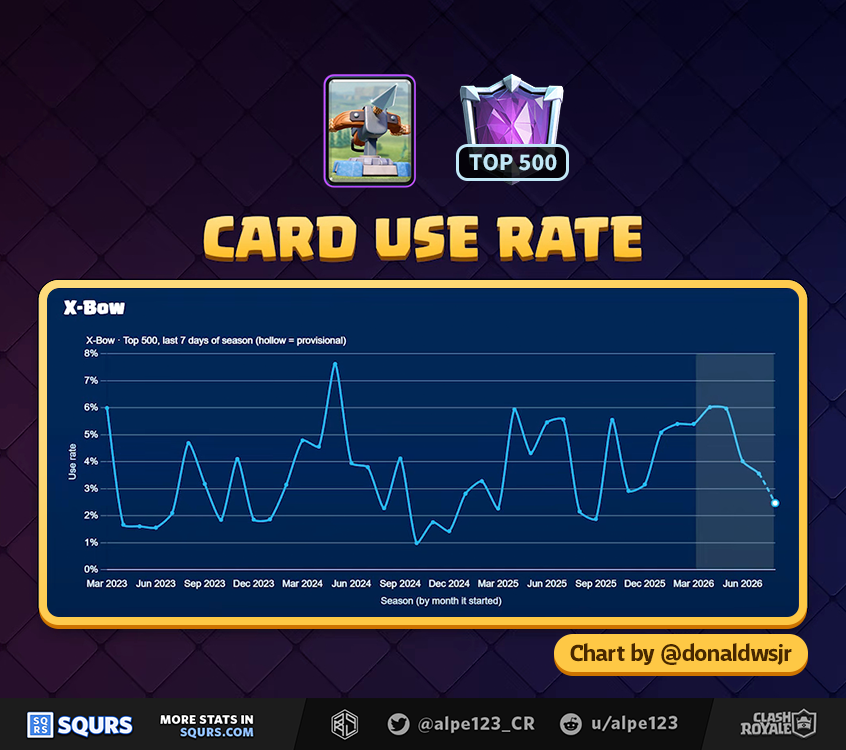
- Top 500: only considers the last week of each season for players among the Top 500 of Ranked
- Battle length: rate of battles that reach a certain duration
Balance History
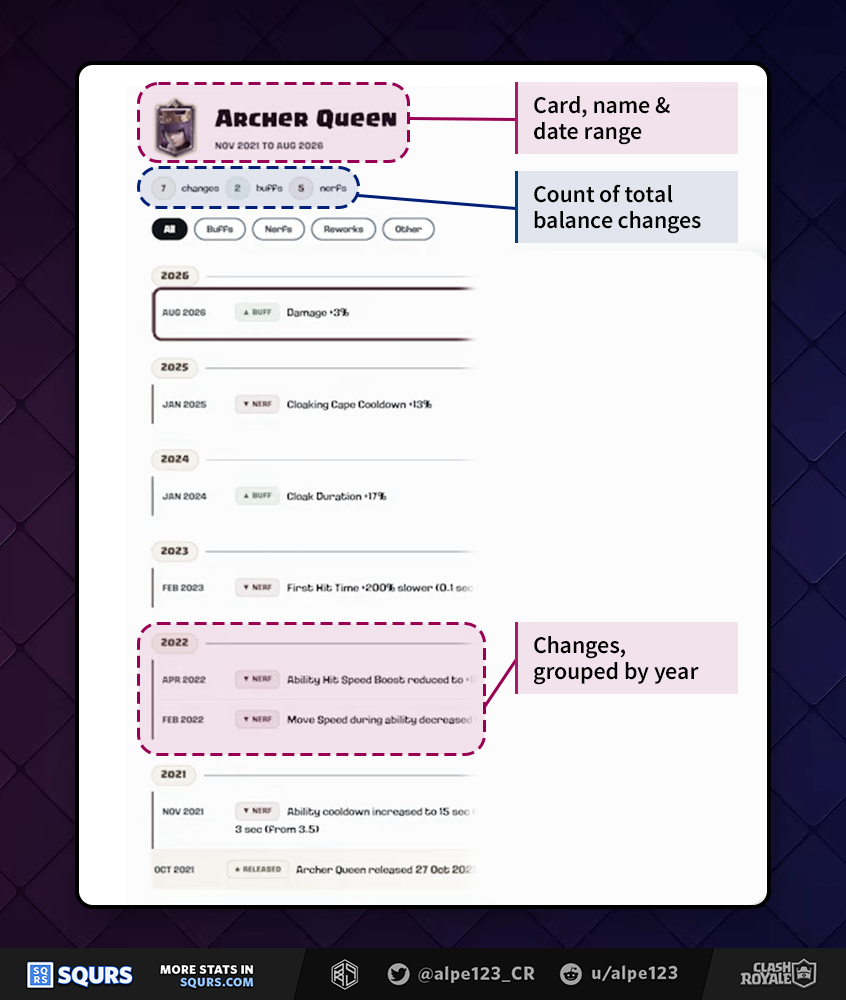
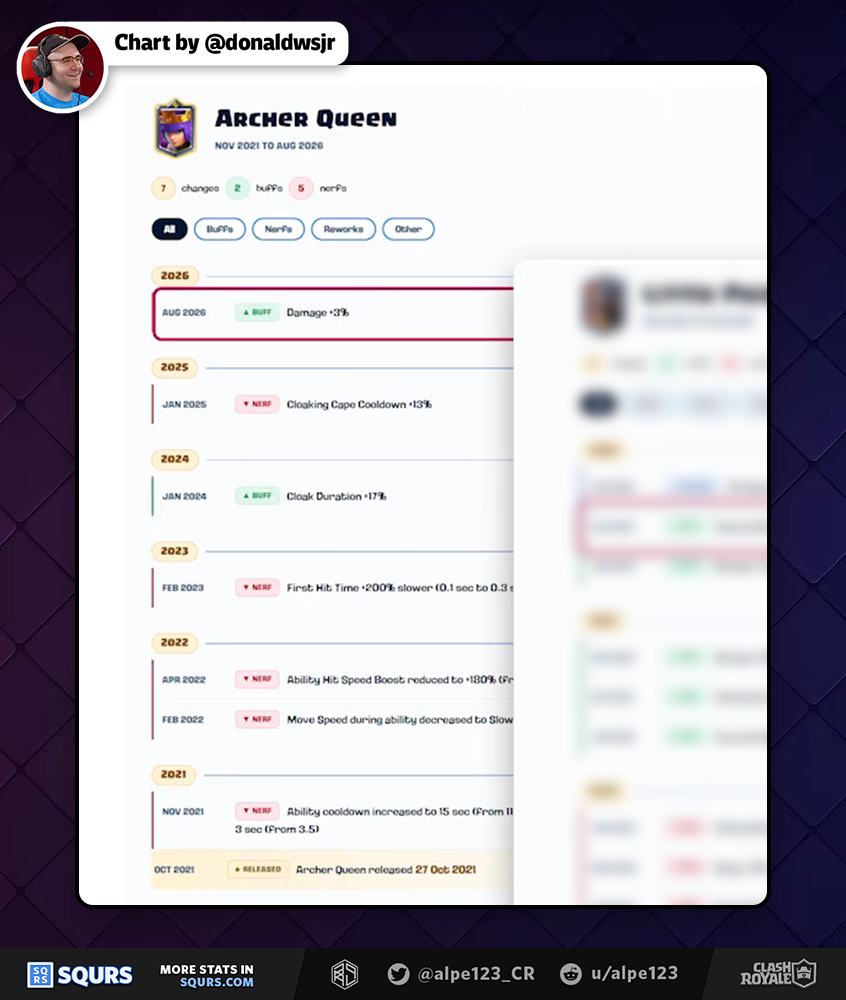
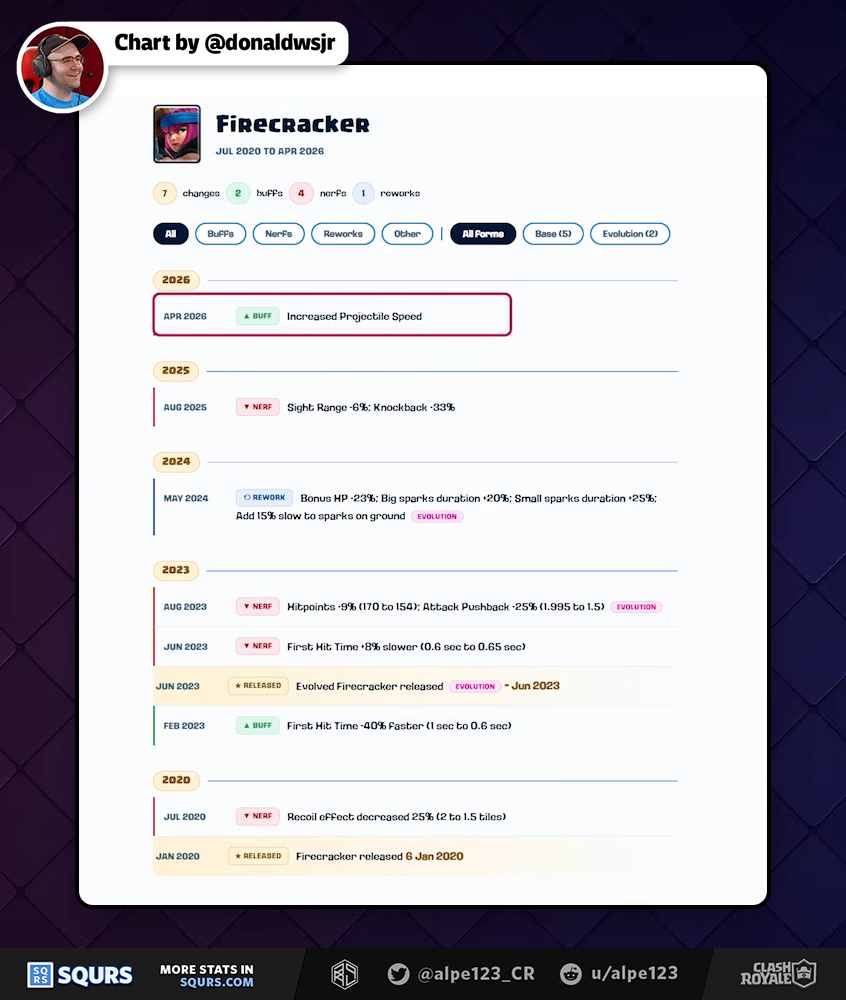
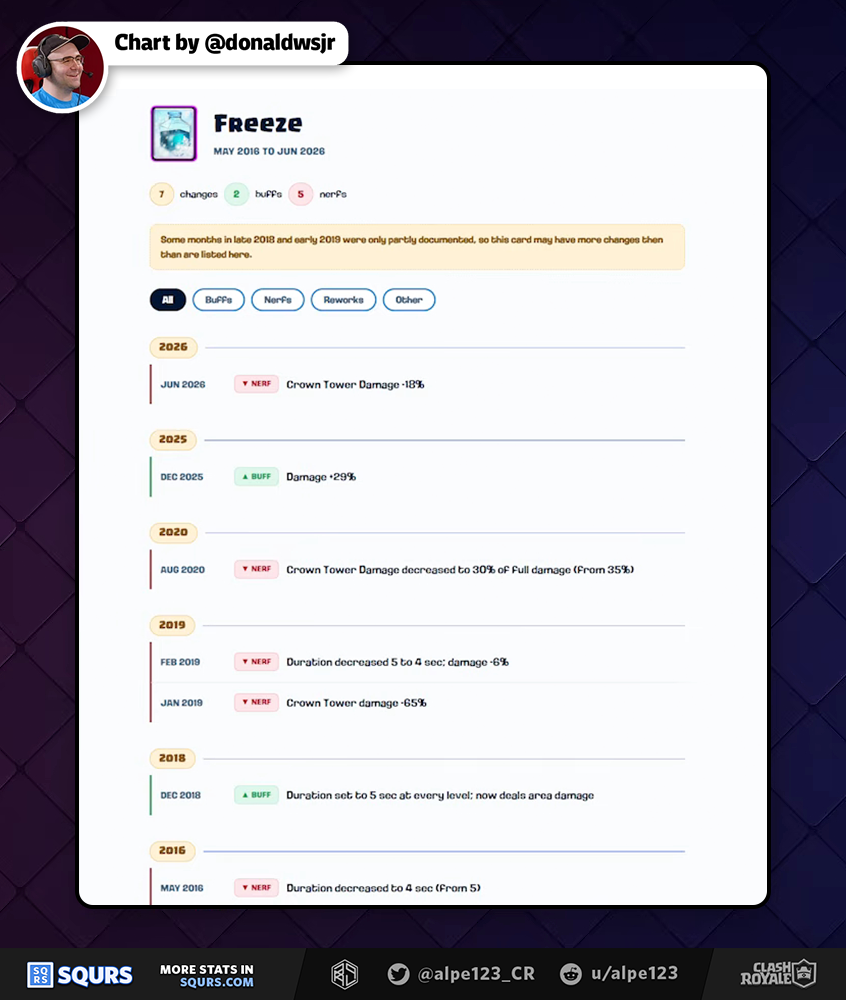
Balance history timelines contain a recap of balance changes that affected a card since it was released. This timelines contain buff/nerf labels for each balance entry, and these entries are grouped together by year.
Timestamps
If you want to watch the context in which the charts were shared, these links will take you to the exact moment in which their frames were appeared.
Card Usage
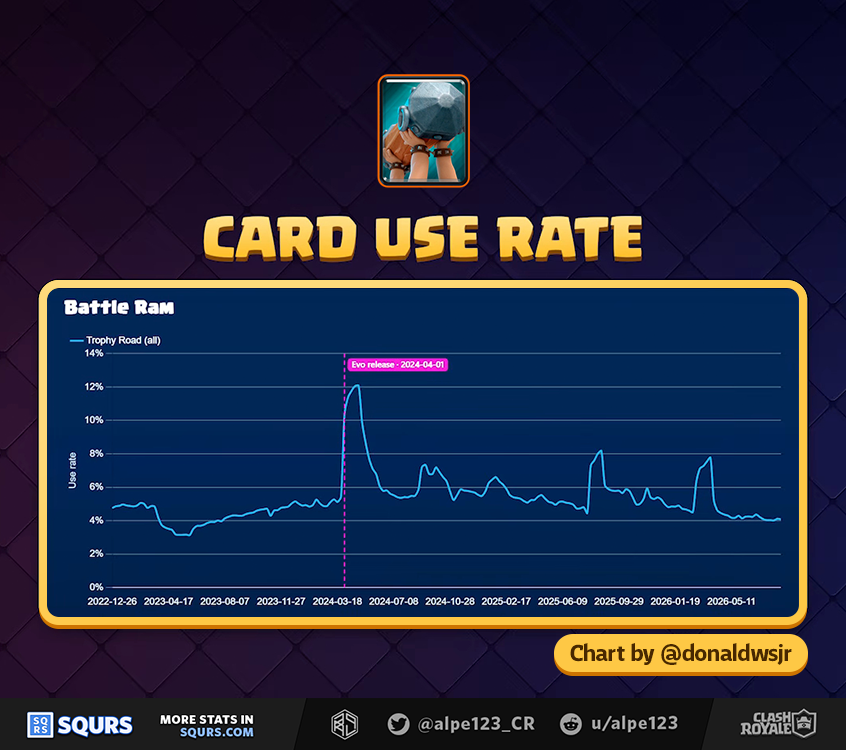
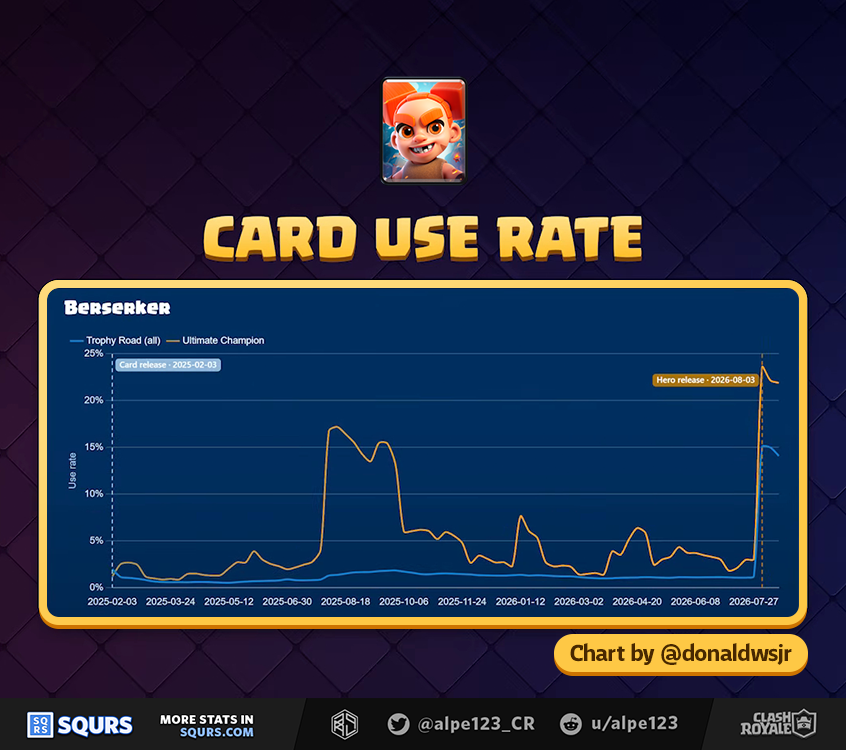
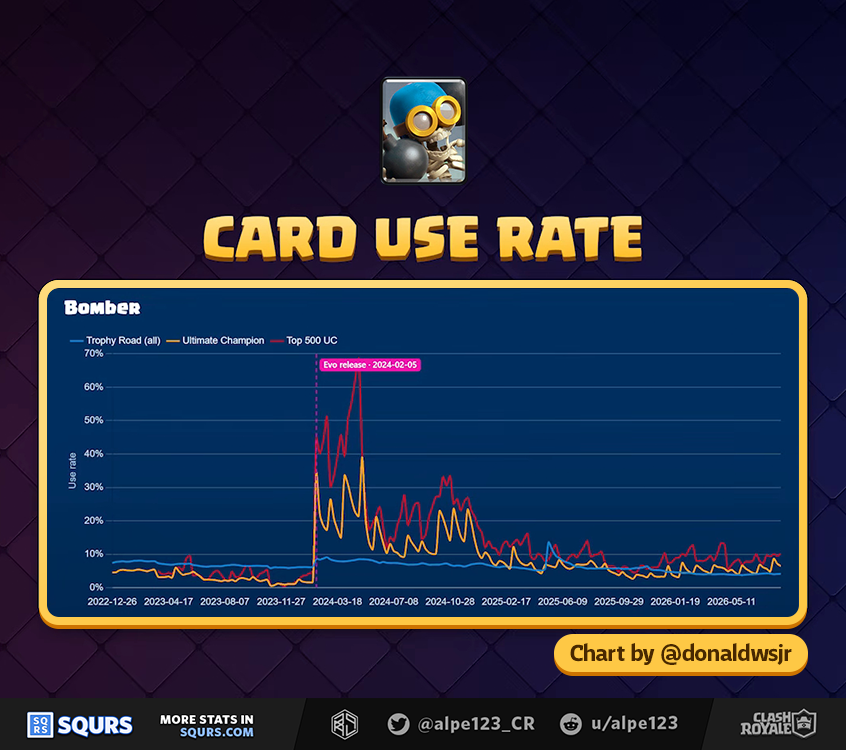
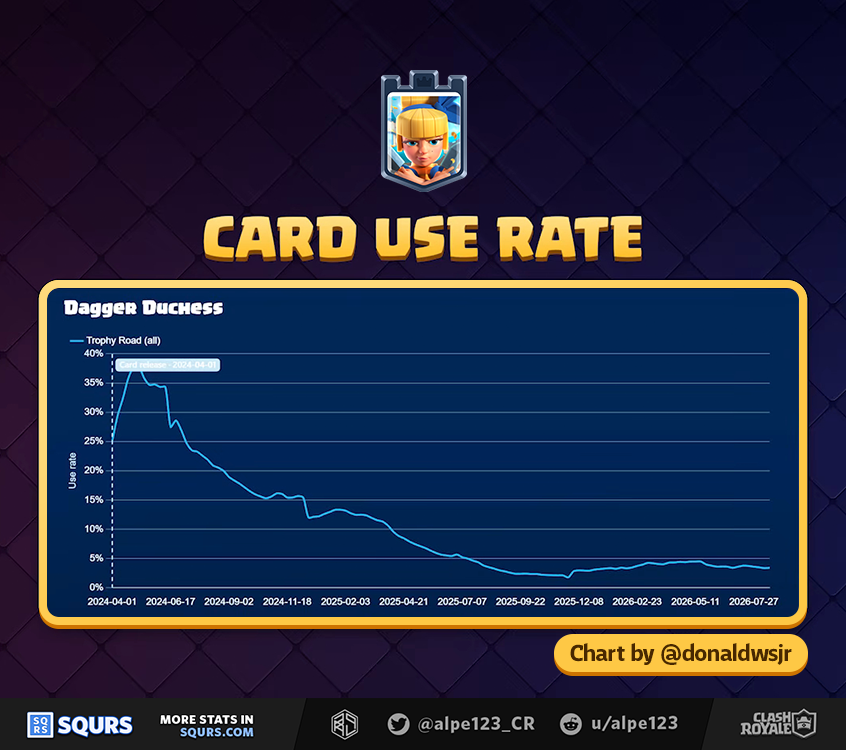
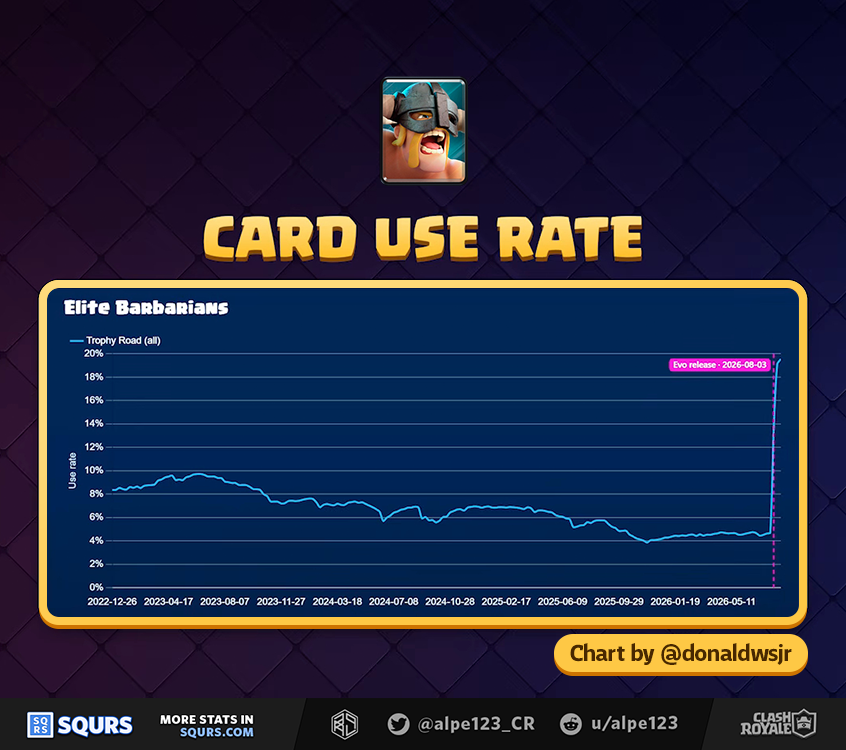
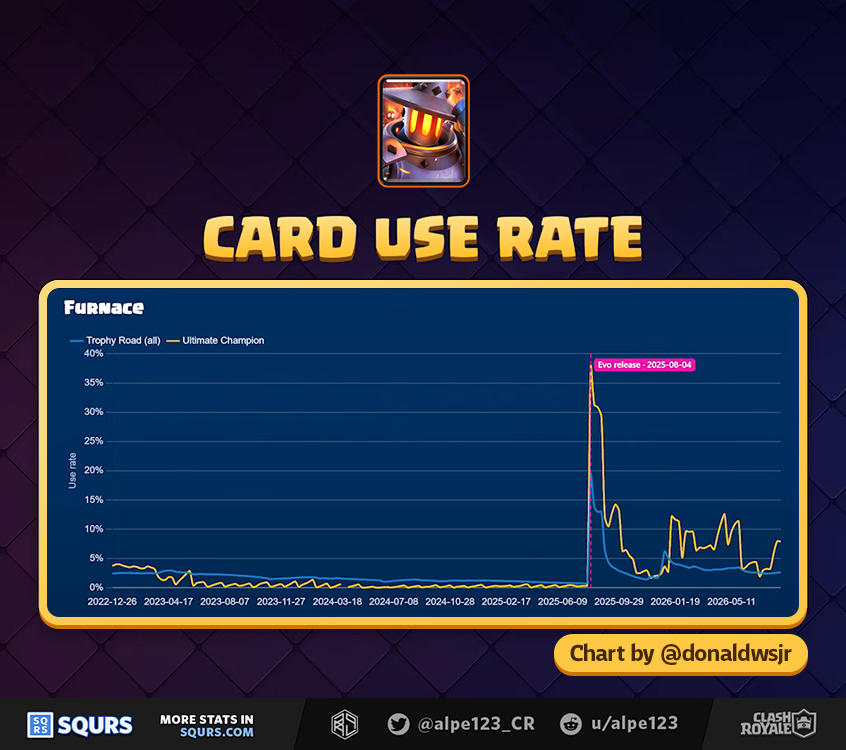
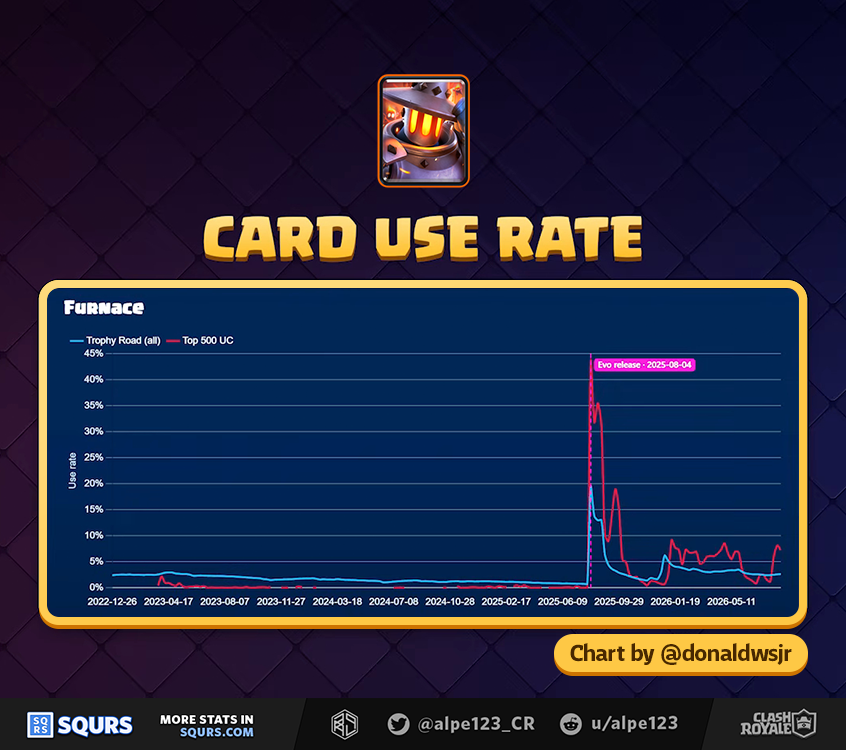
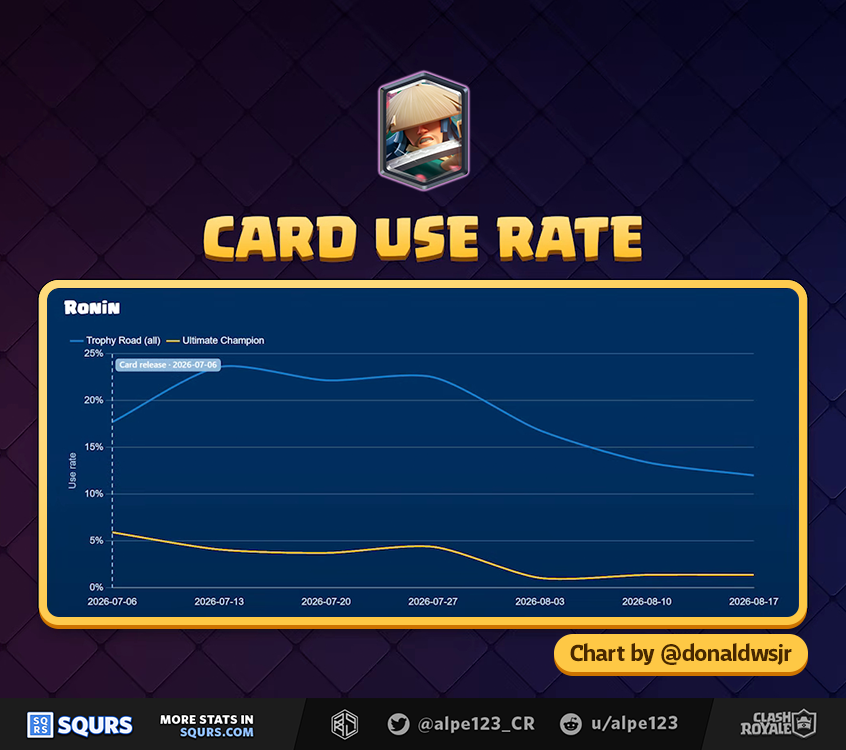
Usage chart have several different types, but they all seem to date back to the start of 2023; this means they only display data of up to 3.5 years.
The game mode selection isn't very consistent across all charts. Some focus on Trophy Road data, and others also include stats from Ultimate Champion and/or Top 500 players.
By Form
There is only one chart of this sort, which compares Snowball with it's evolved counterpart.
Timestamps
If you want to watch the context in which the charts were shared, these links will take you to the exact moment in which their frames were appeared.
By Game Mode
All of these charts contain usage stats of Trophy Road. Some also contain stats of Ultimate Champion and/or Top 500.
Warning:
Usage axis is inconsistent
Timestamps
If you want to watch the context in which the charts were shared, these links will take you to the exact moment in which their frames were appeared.
Top 500
These charts are somewhat different than the previous ones, as they aggregate data into one point per season instead of a continuous time series. The usage value of each season is calculated with the battles played during the last 7 days of each season among players of the Top 500.
Warning:
Usage axis is inconsistent
Timestamps
If you want to watch the context in which the charts were shared, these links will take you to the exact moment in which their frames were appeared.
Battle Duration
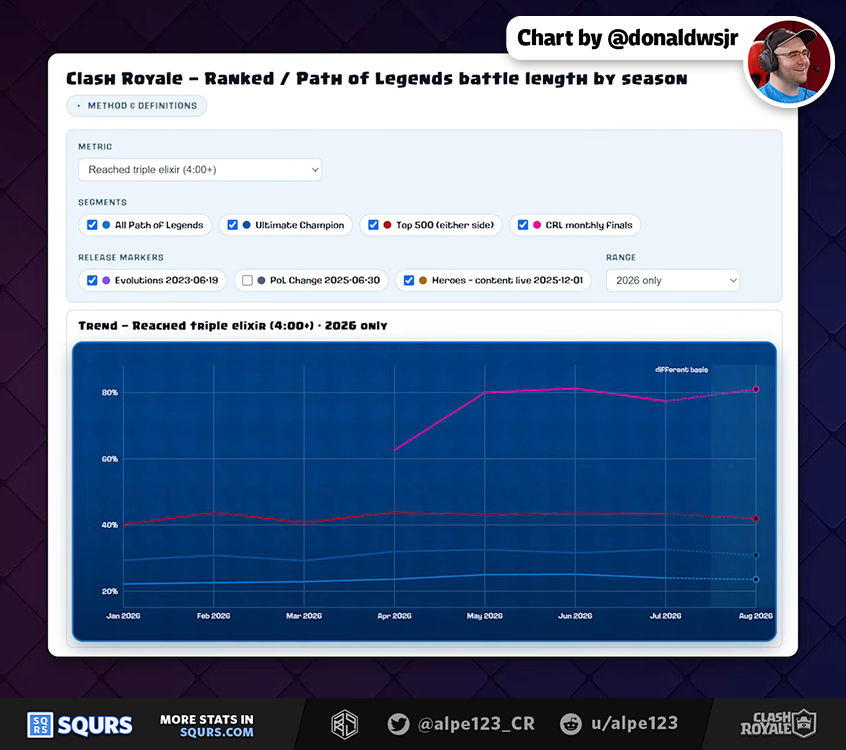
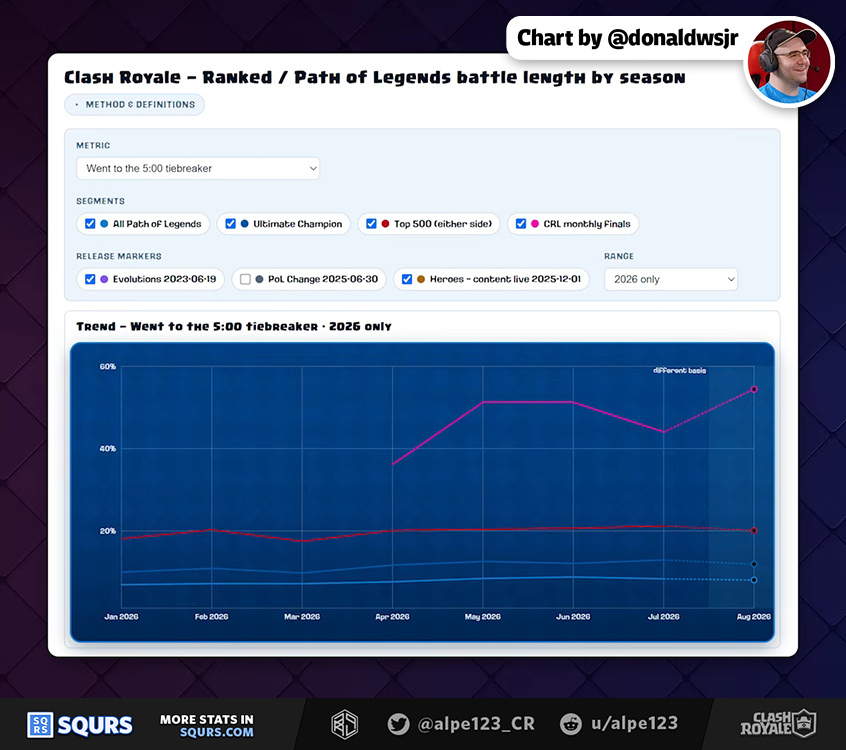
This last kind of chart looks at what share of battles reaches a certain duration.
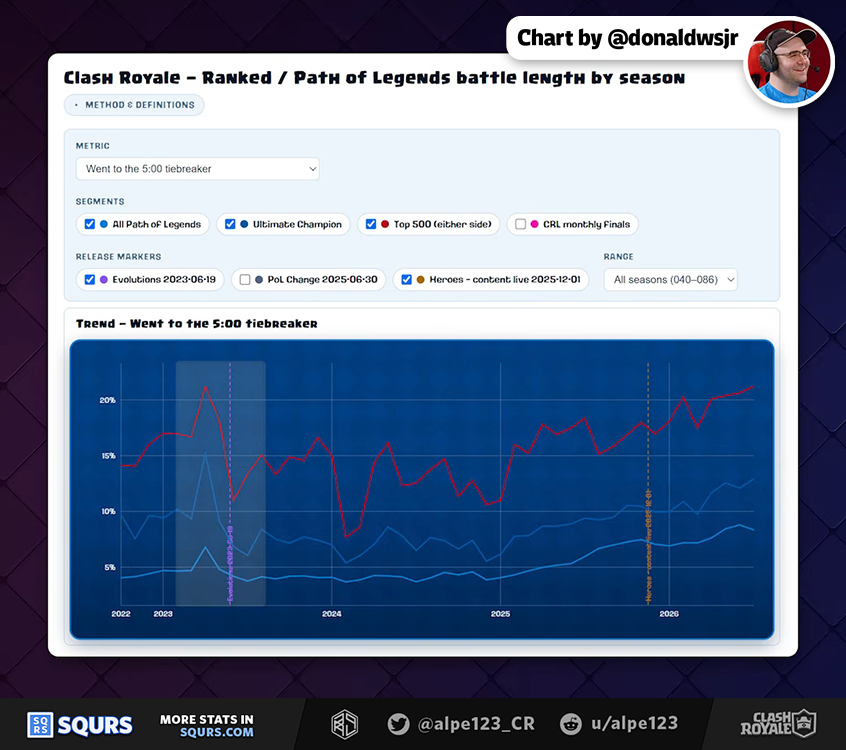
Usually battles finish when the main timer of 3 minutes runs out, but battle duration can be extended into overtime if the score is tied. These charts show how often the overtime reaches the end, as a proxy for battles in which players are unable to deal sufficient damage to enemy towers.
The first 2 charts show battles that reach 4 and 5 minutes, but only for data collected in 2026.
Warning:
Usage axis is inconsistent
Timestamps
If you want to watch the context in which the charts were shared, these links will take you to the exact moment in which their frames were appeared.
Donald also shared another chart for the 5 minutes filter, but this time extending the time series all the way back to 2022.
Timestamps
If you want to watch the context in which the charts were shared, these links will take you to the exact moment in which their frames were appeared.
These snapshots are also interesting due to how they show more UI elements than the rest. Some options of this tool are:
- Filter by different metrics, such as "Reached Triple Elixir" and "Went to Tiebreaker"
- Filter by user segment such as Trophy Road, Ultimate Champion, Top 500 and CRL Monthly Finals
- Add labels to the charts for different relevant events such as the release of Evolutions and Heroes
- Filter by season, going back to Season 40, which started on 2022-10-03
Donald has later mentioned that this was a web tool he made for internal use.